
Top ▲
A key requirement in biomedical research is to identify tool compounds such as agonists and antagonists to characterise particular targets, and secondly to calculate concentrations required to achieve a specific pharmacological action. It is also crucial to know whether there are any differences between species, particularly for translational research, and whether ligands are selective or activities at other targets have been reported.
The interactive ligand activity charts, developed in the IUPHAR/BPS Guide to Pharmacology database, have been designed to quickly summarise pharmacological information, across species, where these data exist for ligands in GtoPdb and ChEMBL. Many pharmacology parameters are reported in the results section of papers and may not appear in the summary, so cannot be easily found in databases such as PubMed.
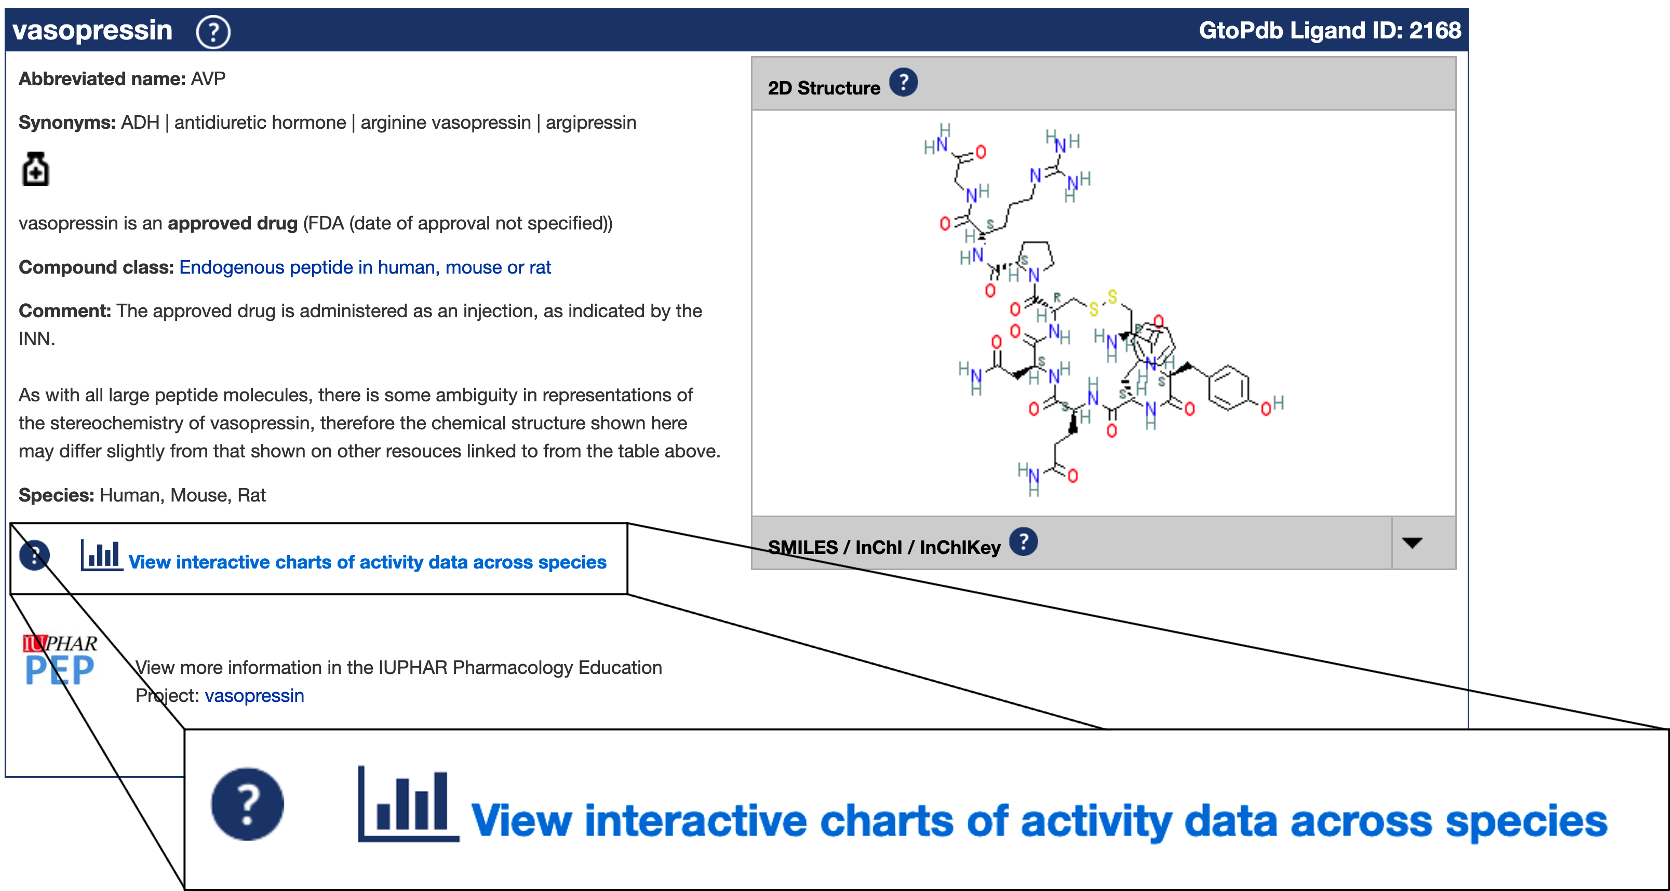
Users can access the charts from a ligand's detailed page. Entering a compound name via the ‘Search Database’ box at the top of the page, clicking on the ligand, and then clicking on the 'View interactive charts of activity data across species' link.
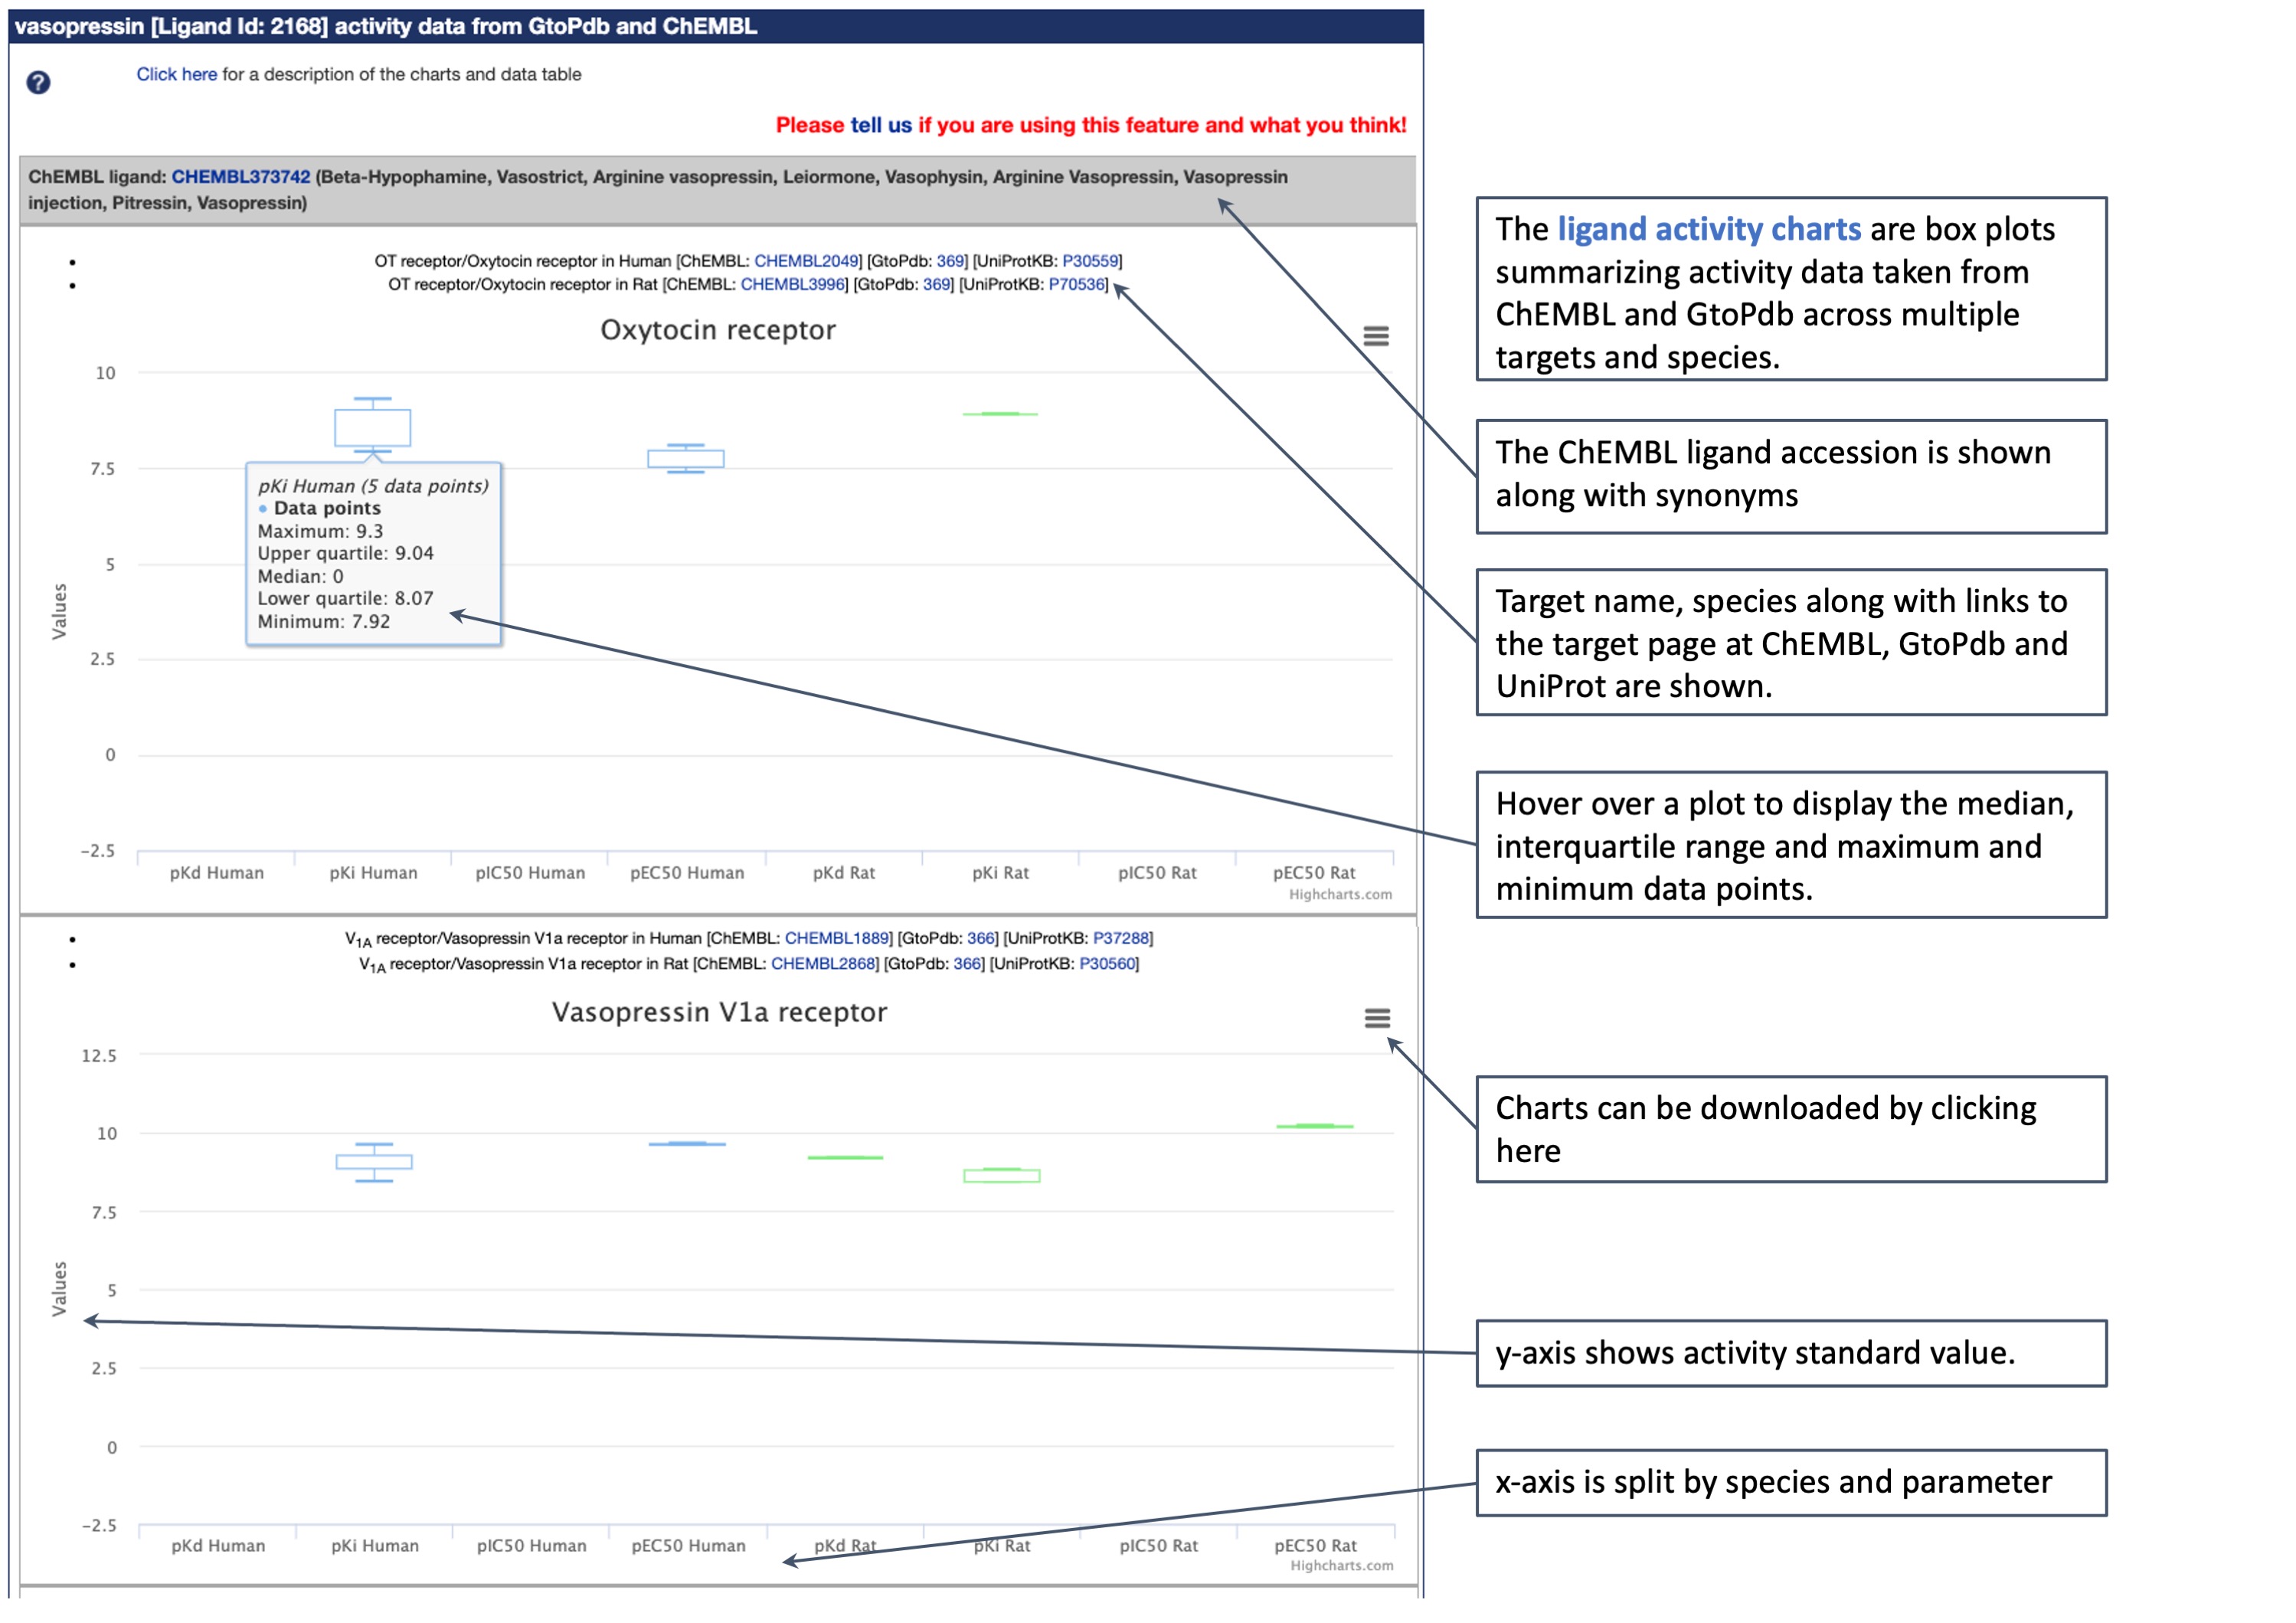
Below are a couple of images detailing how the charts look and the information they provide. The tool displays charts with box plots summarising all the activity data for a ligand taken from ChEMBL and GtoPdb across multiple targets and species. Clicking on a plot will show the median, interquartile range, low and high data points. A value of zero indicates that no data are available. A separate chart is created for each target, and where possible the algorithm tries to merge ChEMBL and GtoPdb targets by matching them on name and UniProt accession, for each available species. However, please note that inconsistency in naming of targets may lead to data for the same target being reported across multiple charts.
The charts show pharmacological parameters expressed as -log10 that are associated with the compound, extracted in real time so the graph always reflects the most recent update from the 8900 entries in GtoPdb and 1.6m in ChEMBL (http://www.guidetopharmacology.org/pdfs/termsAndSymbols.pdf). These may include pIC50 and pEC50 of an agonist from functional assays, PA2 or pKB values for antagonists. For ligand binding assays, affinity values may be reported as pKD, PKi or IC50.
Filtering ChEMBL data - activity data are extracted from ChEMBL 37* according to the following rules:
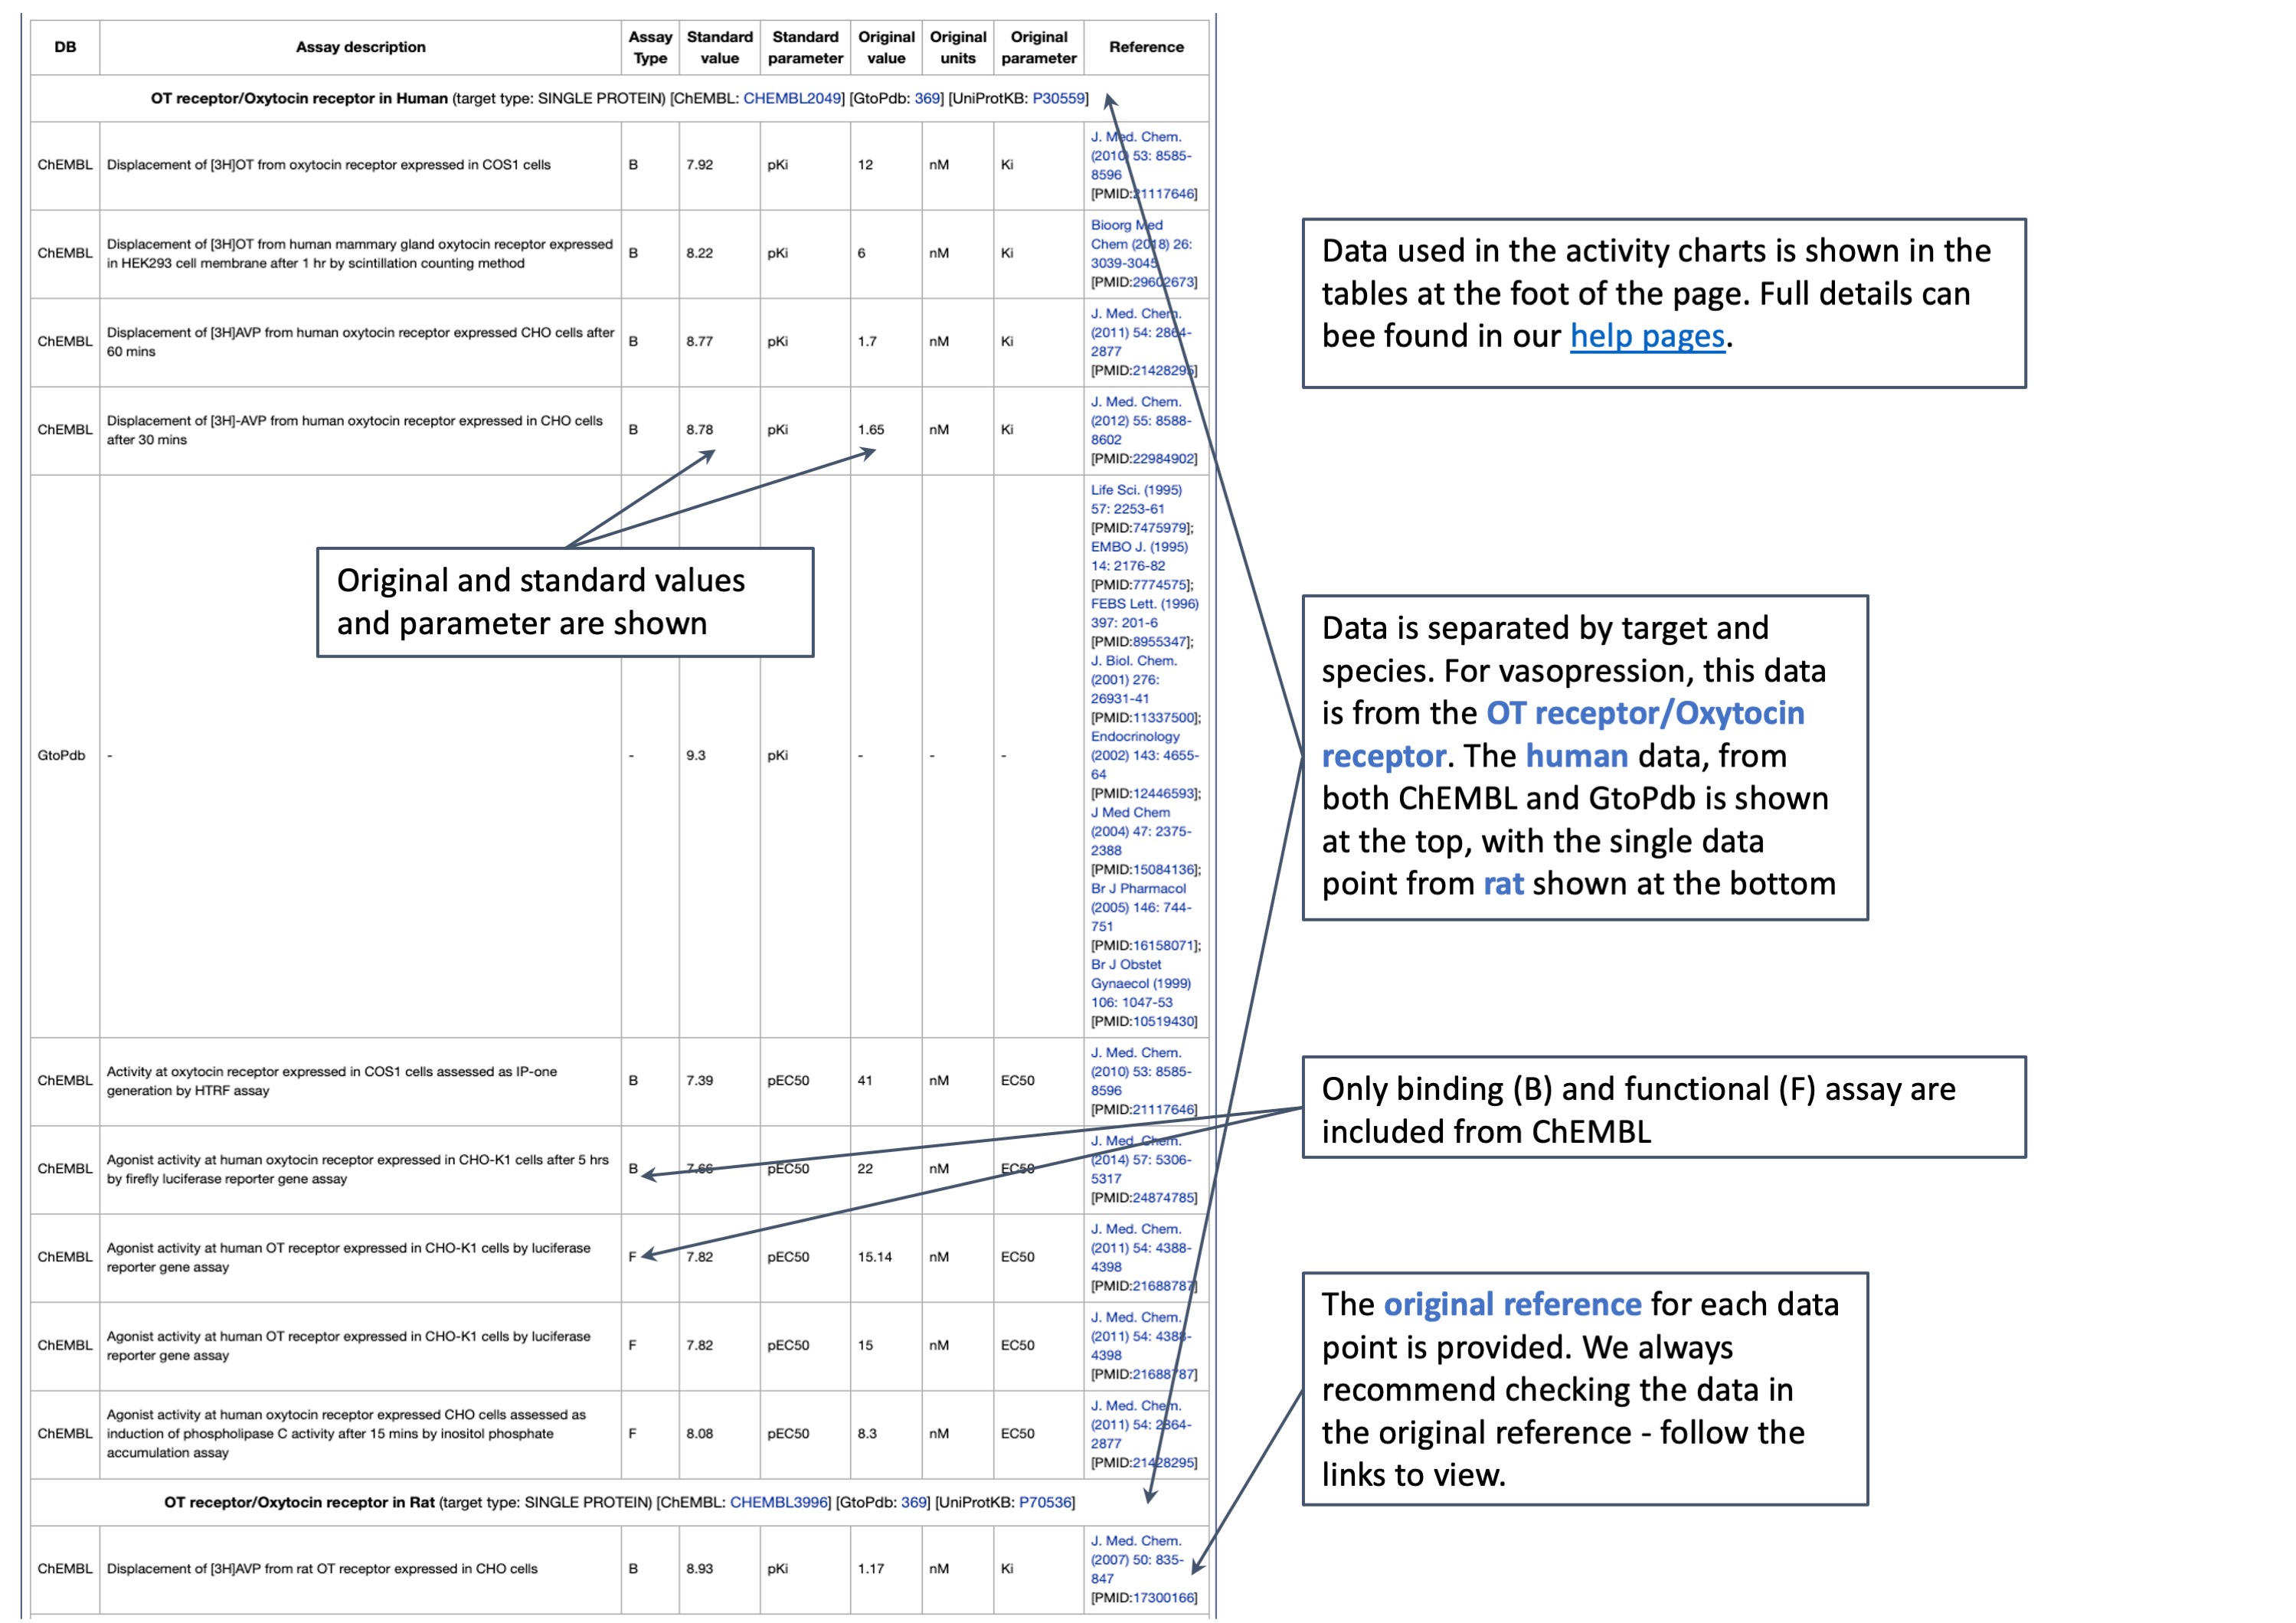
Tables of activity data - Below the charts are tables listing all the data points included in the dataset. These are divided up by target and species and the source database is indicated, with assay description if available. The GtoPdb standard data type (pKd, pKi, pIC50, pEC50 or pA2) and value are given alongside the source database's original value and type (which may be the original data reported in the publication or that has been further curated by the ChEMBL team using one of the activity types given above). We recommend always checking the data in the original reference, which is provided along with a PubMed link.
*For more information about ChEMBL see their publication:
Zdrazil B, Felix E, Hunter F, Manners EJ, Blackshaw J, Corbett S, de Veij M, Ioannidis H, Lopez DM, Mosquera JF, Magarinos MP, Bosc N, Arcila R, Kizilören T, Gaulton A, Bento AP, Adasme MF, Monecke P, Landrum GA, Leach AR. (2024). The ChEMBL Database in 2023: a drug discovery platform spanning multiple bioactivity data types and time periods. Nucleic Acids Res., 52(D1). DOI: 10.1093/nar/gkad1004. [EPMCID:10767899] [PMID:37933841]


