GtoPdb is requesting financial support from commercial users. Please see our sustainability page for more information.
|
Compound class:
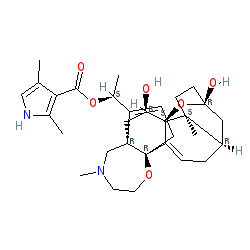
Natural product
Comment: Batrachotoxin is a neurotoxin that is produced by species of frogs (e.g. poison dart frogs), birds, and beetles. Structurally it is a steroidal alkaloid compound.
Ligand Activity Visualisation ChartsThese are box plot that provide a unique visualisation, summarising all the activity data for a ligand taken from ChEMBL and GtoPdb across multiple targets and species. Click on a plot to see the median, interquartile range, low and high data points. A value of zero indicates that no data are available. A separate chart is created for each target, and where possible the algorithm tries to merge ChEMBL and GtoPdb targets by matching them on name and UniProt accession, for each available species. However, please note that inconsistency in naming of targets may lead to data for the same target being reported across multiple charts. ✖ |
|
|||||||||||||||||||||||||||||||||||
| References |
|
1. Bosmans F, Maertens C, Verdonck F, Tytgat J. (2004)
The poison Dart frog's batrachotoxin modulates Nav1.8. FEBS Lett, 577 (1-2): 245-8. [PMID:15527793] |
|
2. Linford NJ, Cantrell AR, Qu Y, Scheuer T, Catterall WA. (1998)
Interaction of batrachotoxin with the local anesthetic receptor site in transmembrane segment IVS6 of the voltage-gated sodium channel. Proc Natl Acad Sci USA, 95 (23): 13947-52. [PMID:9811906] |
|
3. Sheldon RS, Cannon NJ, Duff HJ. (1986)
Binding of [3H]batrachotoxinin A benzoate to specific sites on rat cardiac sodium channels. Mol Pharmacol, 30 (6): 617-23. [PMID:2431264] |
|
4. Wang SY, Wang GK. (1998)
Point mutations in segment I-S6 render voltage-gated Na+ channels resistant to batrachotoxin. Proc Natl Acad Sci USA, 95 (5): 2653-8. [PMID:9482942] |